

While it is useful to look at the entire membership, sometimes you just want to focus on new members or former members and trends involving just those specific sets of accounts. DataFlex has multiple reports already built just to do that. Today I’d like to talk about those reports and dashboards.
New Member Reports
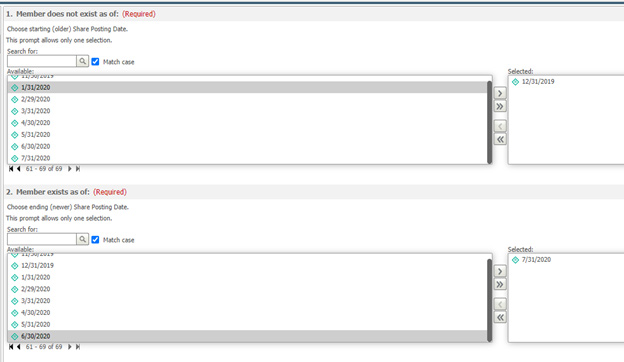
DataFlex can track the date that member joined the credit union, and also when that member no longer has any open accounts and has left the credit union. The most basic version of this report prompts the user for a starting date and an ending date. Once these two are selected, the report will show the members that joined the credit union in the selected timeframe.
From here, it is trivial to build upon this report to see how many shares or loans have been added by these new members. Of course, the type of products and their balances can be examined as well.
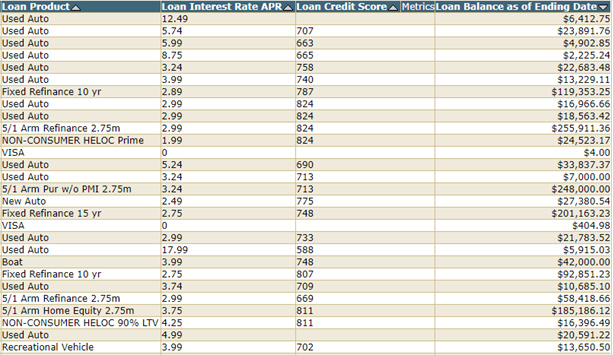
Now that this basic report has been set up, it is simple to add additional pieces of account data such as Branch and Interest Rate or demographic information such as Age and Home Ownership for further in-depth research. Filters can also be quickly and easily added to examine only certain categories of products, specific range of product balances, or certain geographical regions. Even more advanced reports can be built to look at the relationships between new members and other products such as online banking or mobile banking.
Lost Member Reports
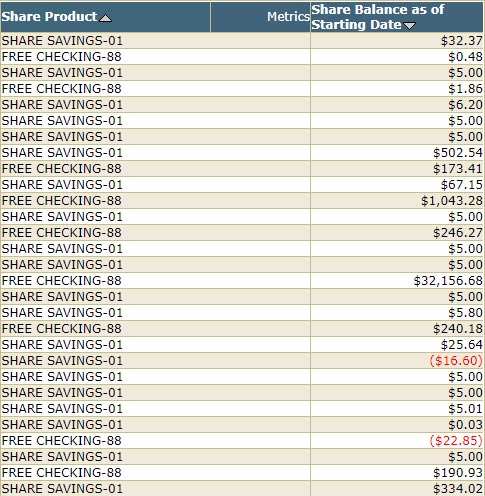
Similarly, it is straightforward to analyze the lost members that have left the credit union. Displayed In the report below are the share products and balances at the beginning of the year for former members. As expected, nearly all of these are basic savings and checking accounts with low balances and no rewards checking or certificates or other products. Again, additional data attributes can be added to see if there’s any underlying common denominators or trends among these lost members.
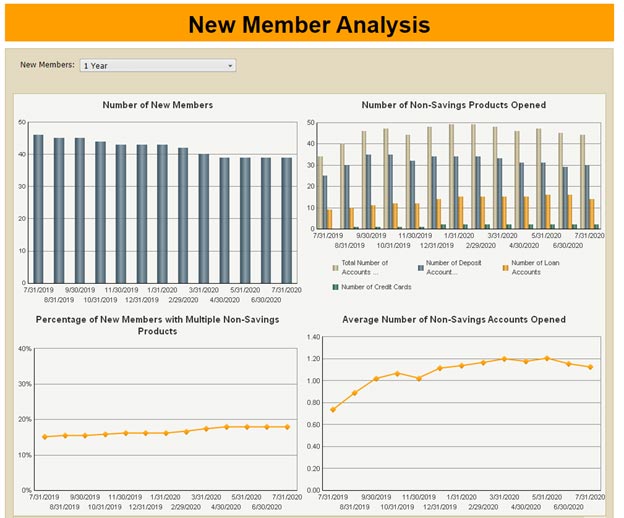
Dashboards
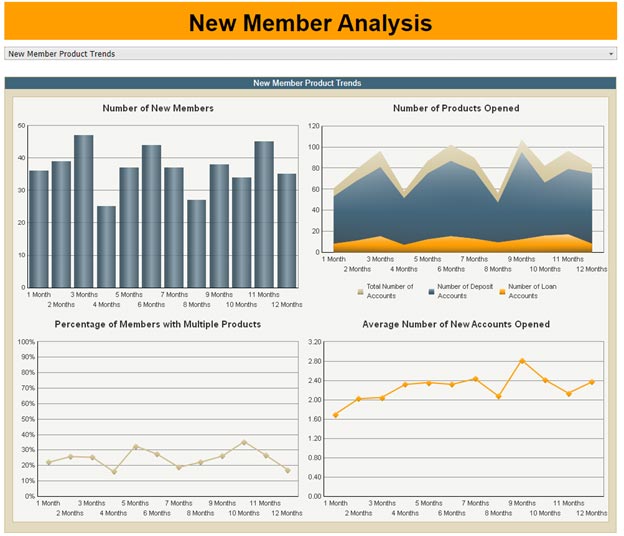
While reports are great for drilling into the details, dashboards and other visualizations are very helpful for looking at overall trends and monitoring the trajectory of products and balances over time. Especially interesting from a profitability and retention standpoint is the number of members that have multiple accounts. Here are examples of two simple, yet information-packed dashboards showing new member trends.
Contact us today to find out more about DataFlex
I hope these report and dashboard examples are useful tools and also inspire you with ideas on how to create even more insightful reports. Tracking new members will help measure the effectiveness of your on-boarding process. Monitoring the attributes of closed accounts can detect trends that could impact the size and profitability of the membership. Contact LKCS today to learn more about DataFlex and what it can do for you.
Did you like this blog post?
Get more posts just like this delivered twice a month to your inbox!
