

Earlier this year we upgraded our DataFlex platform to take advantage of ever-increasing software technology and browser capabilities. Although most of the updates are “under the hood”, there are some other more visible enhancements that I would like to take some time to discuss.
Data Wrangling
DataFlex has previously had the ability to import data for an ad hoc report. With the recent update, this capability has been expanded and made even easier to use. You can explore your imported data to evaluate its quality and usability. You can then prepare your data to improve its quality before you import it into DataFlex. For example, you can remove white space, filter your data, delete duplicate rows or cells, find and replace data, concatenate columns, and so on. This process is referred to as data wrangling. The update also more easily links fields from external databases to do more advanced reporting, tying together data from multiple sources.
Modern Browsers
As modern browsers improve rapidly with each update, the security and graphics capabilities also increase. As a result, Flash is being phased out in favor of newer, more secure technologies. DataFlex has been similarly updated to move away from the use of Flash in the dashboards. Newly created dashboard will no longer offer “Flash mode” and older dashboards have been updated to run a new HTML 5 mode.
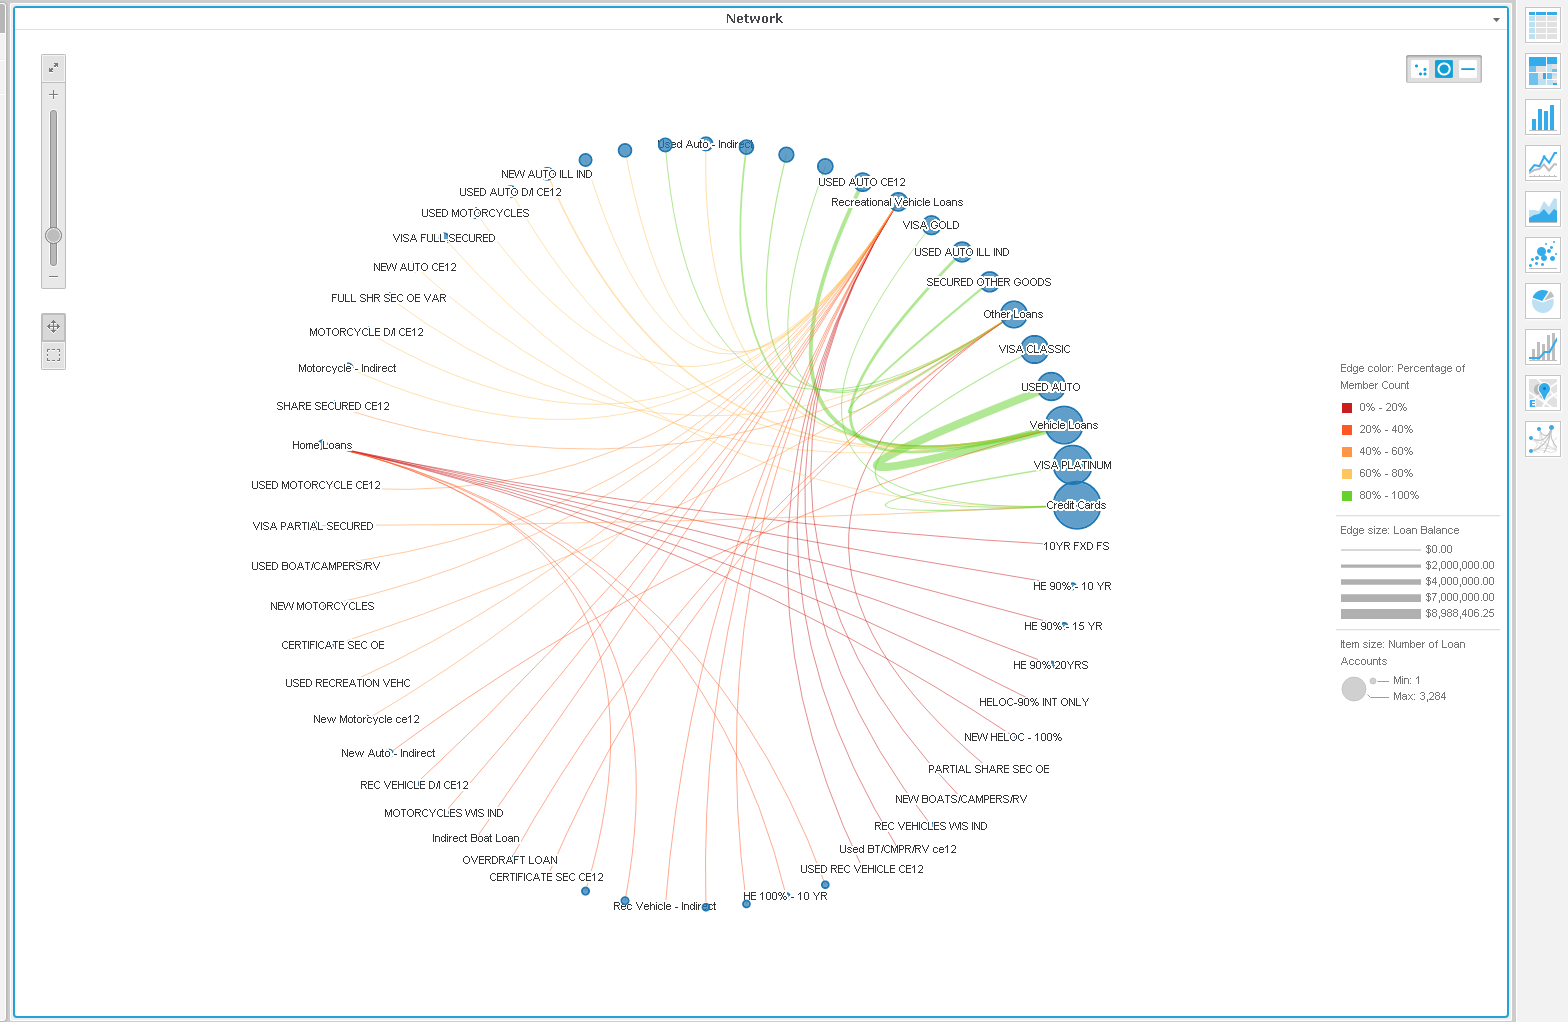
Visualizations
The graph visualizations are another area of attention in the most recent update. More graph options have been added. They include: the ability to drag and drop dataset objects directly onto the graph area to add them to the graph, more flexible dual-axis and combination graphs, and trend lines and reference lines.
Dynamic Conditions in Filters
You can use dynamic conditions in a view filter on a grid or a graph. This allows the user to choose items in a selector and then DataFlex will dynamically update the qualifications in a view filter. For example, a user can select the CDs and Money Market categories in a selector. The grid is then filtered to display data only for CDs and Money Markets of a certain value or term. You can combine dynamic conditions with other qualifications to create more complex filtering than is possible with selectors alone.
Contact us today to find out more about DataFlex
The new features I talked about make DataFlex easier and more enjoyable to use than ever. Using the new data wrangling tools, powerful filters and visualizations, and utilizing modern browsers and web design, you’ll be able to analyze your account holders and their products in new ways. Contact LKCS today to learn more about DataFlex and what it can do for you.
Did you like this blog post?
Get more posts just like this delivered twice a month to your inbox!
